
Appendix A: Example Workflow: AI Cost Optimization
Goal: Predict probability of cost inefficiency / waste per SaaS subscription, API usage stream, or department for next 2 weeks
Data: Sequential cost/usage data (API calls, seats used) + static metadata (team, vendor, pricing tier, contract terms)
Predictive horizon: 14–30 days (depends on billing cycle / renewal windows)
Usage: Cost optimization (preemptive downgrade, route, or cancellation)
Motivation: Enterprise SaaS Sprawl + AI Token Waste = €500K-€5M Annual Leak
The Problem
Every enterprise is experiencing:
AI API costs exploding (OpenAI, Anthropic, Cohere bills growing 40% monthly)
Token waste: 60-70% of LLM calls could use cheaper/faster models
SaaS subscription chaos: 400+ tools, 40% unused, contracts auto-renewing
No visibility: CFOs have no idea what's being spent where
Real Example: European fintech with 500 employees:
€2.3M annual AI API costs (discovered after audit)
€890K in unused SaaS subscriptions
No centralized tracking system
Contracts scattered across departments
ChordianAI Solution
ChordianAI "CostGuard AI" - Intelligent Spend Orchestration
SEARCH Layer:
Connects to: Stripe, AWS billing, OpenAI dashboard, Salesforce, procurement systems
Semantic analysis of: Contracts, usage logs, API calls, employee directories
Knowledge graph: Who uses what, license types, renewal dates, actual vs. purchased seats
ANALYZE Layer:
Problem classification: "Multi-dimensional cost optimization with usage prediction"
Identifies patterns:
"Marketing team using GPT-4 for tasks GPT-3.5 could handle (€12K/month waste)"
"85 Zoom licenses for team of 62 people (23 haven't logged in for 3 months)"
"3 different project management tools (Asana, Monday, Jira) with 70% overlap"
Generates optimization blueprint
OPTIMIZE Layer:
Classical AI agents:
Route AI requests to cheapest adequate model (GPT-4 → GPT-3.5 → Claude Haiku)
Predict which subscriptions will be unused next quarter
Negotiate renewal timing for bulk discounts
Hybrid optimization:
Solve: Minimize total spend while maintaining productivity
Constraints: Team preferences, integration dependencies, contract terms
Outputs: Specific cancellation recommendations, consolidation opportunities
Dataset Design
We can define 3 main prediction entities, each producing its own time series.
1. AI API Cost Stream
Objective: Predict which API usage streams (e.g., per model or per department) will exceed optimized cost thresholds in the next 2 weeks.
Target variable: future_cost_waste_flag ∈ {0,1} or regression target expected_cost_increase_%.
Sequential features (daily or weekly time steps):
Feature | Description |
|---|---|
api_calls_total | Number of API calls |
tokens_used_total | Total tokens used |
avg_cost_per_call | Average cost per call |
model_type_ratio | % calls per model (GPT-4 / GPT-3.5 / Claude) |
time_of_day_usage_distribution | % of calls off-hours |
batch_processing_ratio | % of calls already batched |
department_activity_index | Normalized department load |
Static features:
Feature | Description |
|---|---|
department | Which department uses this API |
contract_type | Pay-as-you-go / subscription / volume discount |
task_type | Internal vs customer-facing |
price_per_token | Billing rate |
integration_dependency | Critical / optional / experimental |
Prediction horizon:
Use past 30 days (granularity daily) → predict next 14 days total cost / waste probability.
2. SaaS Subscription Stream
Objective: Predict underutilized or unnecessary tools for the next quarter (early warning for cancellation or consolidation).
Target variable:
underutilization_flag ∈ {0,1} or expected_utilization_% next_month.
Sequential features (weekly granularity):
Feature | Description |
|---|---|
active_users_ratio | % of licensed users active |
login_frequency_mean | Mean logins per active user |
feature_usage_diversity | How many modules used |
support_tickets | Tickets opened by this team |
api_integration_calls | System-to-system interactions |
renewal_reminder_offset | Days until auto-renewal |
previous_cancellations_in_team | Historical cancellations in same team |
Static features:
Feature | Description |
|---|---|
department_size | Employees in team |
license_type | Standard / Pro / Enterprise |
vendor_category | Communication / PM / Dev / Analytics |
monthly_cost | Cost per license |
integration_overlap_score | Similarity to other active tools |
Prediction horizon:
Use past 12 weeks → predict next 4 weeks expected utilization.
3. Vendor Contract Stream
Objective: Predict which contracts are at risk of cost spikes due to renewal clauses or scaling behavior.
Target variable:
renewal_risk_flag ∈ {0,1} (risk of auto-renewal without utilization check).
Sequential features (monthly):
Feature | Description |
|---|---|
spend_trend | Monthly spend change |
user_growth_rate | Growth in seat usage |
cost_per_user | Current vs contract price |
contract_utilization_ratio | Actual / purchased seats |
renewal_window | Days to renewal |
prior_renegotiation_success | Binary feature |
Static features:
Feature | Description |
|---|---|
vendor_type | SaaS / AI API / Infrastructure |
contract_length_months | Duration |
discount_type | Volume / Prepaid / Usage-based |
team_dependency_level | Low/Medium/High |
Prediction horizon:
Use past 6 months → predict next 1 month renewal risk.
Model Configuration
UniForecaster’s architecture can be used directly, with:
Multi-stream time-series inputs (via embedding per entity)
Static feature conditioning (via cross-attention or appended latent)
Single output head → classification (risk flag) or regression (expected cost)
Suggested configuration
Parameter | Value |
|---|---|
Encoder window | 30–90 timesteps (days/weeks depending on domain) |
Forecast horizon | 14 days (for costs), 4 weeks (for subscriptions) |
Feature dim | ~50 per stream (after embedding) |
Loss | BCE or MSE depending on target type |
Output | Waste probability or expected cost delta |
Example Prediction Questions
“What’s the probability that the Marketing team’s GPT-4 usage will exceed optimized cost by >20% in next 2 weeks?”
“Which SaaS tools will fall below 30% utilization next month?”
“Which contracts are at highest risk of auto-renewal waste?”
These predictions feed directly into ChordianAI CostGuard’s OPTIMIZE layer, driving automated actions:
Reroute API calls
Flag licenses for cancellation
Trigger negotiation workflows
Data Sources
To build training data:
Stripe / AWS / OpenAI / Anthropic billing exports (daily usage & cost)
SaaS admin dashboards (Okta, Google Workspace, MS365) → user activity logs
Procurement / ERP systems for contract metadata
Employee directory → team mapping for static conditioning
Historical sequences can be easily simulated from these sources because they all provide timestamped usage & cost metrics.
Results
This analysis uses UniForecaster, a prediction module, to forecast API usage cost dynamics for the next 14 days and identify key drivers of inefficiency.
The model ingests 30 days of historical daily usage data per API stream and predicts whether each stream is likely to exceed optimal cost thresholds in the next two weeks.
This result page summarizes:
Forecasted cost trajectory
Importance of underlying usage drivers
Risk interpretation
ROI potential
Recommended optimization actions
Cost Forecast for the Next 14 Days
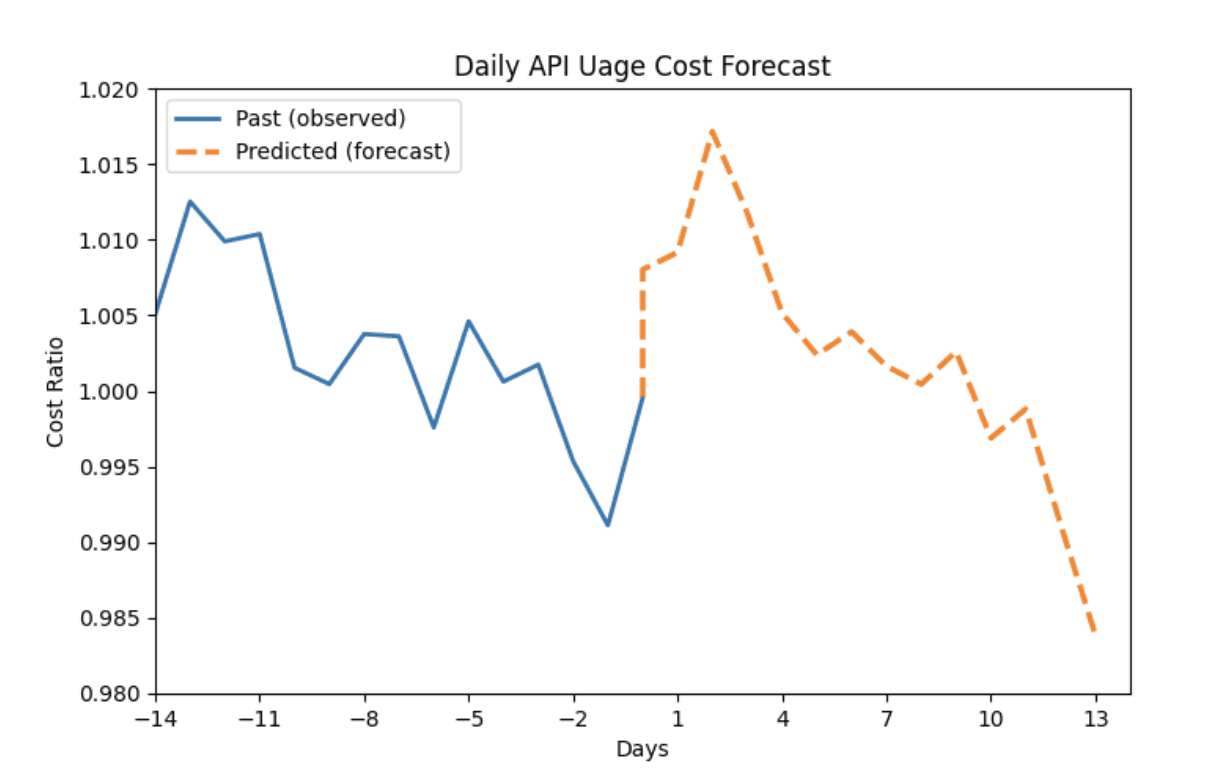
Interpretation
The blue line shows the past observed cost ratio for this API stream (cost / optimized threshold).
The orange dashed line shows the forecasted cost ratio for the next 14 days.
Values > 1.0 indicate projected cost inefficiency relative to the optimized baseline.
Key Insight
The stream crosses 1.0 shortly after the forecasting horizon begins, indicating a high probability of cost overshoot.
The model predicts a short-term spike, likely driven by increased calls, rising per-call cost, or inefficient routing.
This early warning enables corrective action before overspend happens
Drivers of Cost Risk – Feature Importance
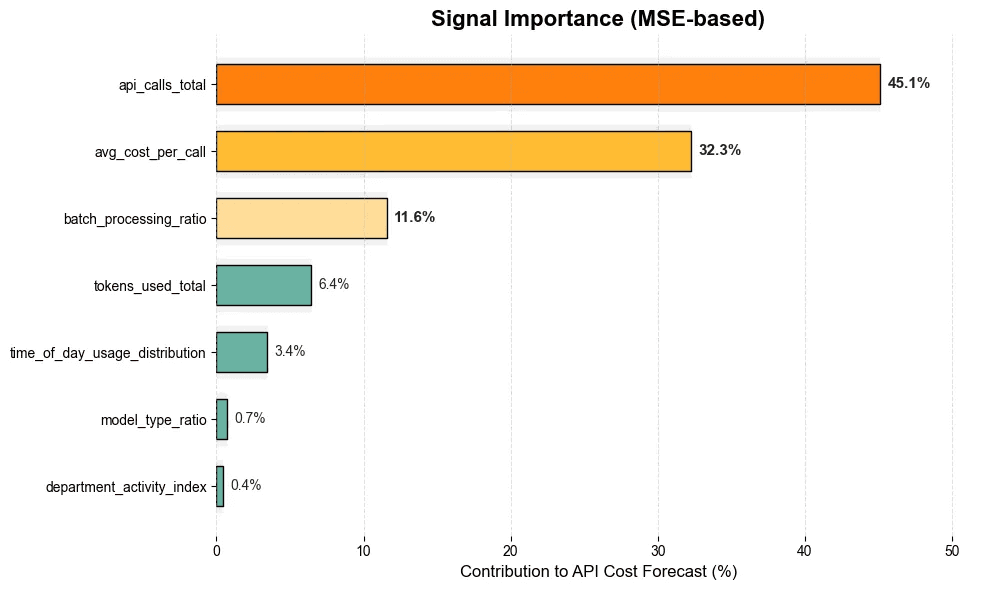
What This Means
The model quantifies which parameters most strongly influence the cost forecast.
Top Contributors
Feature | Interpretation |
|---|---|
api_calls_total (45.1%) | Volume is the dominant cost driver. Increased call frequency strongly correlates with total cost rise. |
avg_cost_per_call (32.3%) | Pricing efficiency is the second major factor — likely excessive use of premium models (e.g., GPT-4). |
batch_processing_ratio (11.6%) | Low batching or real-time usage increases cost. |
tokens_used_total (6.4%) | High token consumption indicates verbose prompts or inefficient chat patterns. |
time_of_day_usage_distribution (3.4%) | Off-hours usage creates avoidable cost spikes. |
model_type_ratio (0.7%) | Minor contributor (indicates low volatility in model choice for this stream). |
department_activity_index (0.4%) | Department-level demand had minimal predictive impact in this case. |
Implication
Cost overruns are not random — they are systematically driven by a small number of operational behaviors.
This reveals where exactly optimization effort will produce ROI.
Risk Assessment
Risk Level: High
The forecast indicates:
Cost ratio rising above 1.0 shortly after day 0
A distinct peak between days 3–6
Weak signs of natural self-correction
Without intervention, this API stream will generate above-threshold spend with high confidence.
ROI Estimation
Let’s quantify potential value.
Baseline
Current spend (example): €18,000 / month
Optimized spend if routed to cheaper models / batching applied: ~€8,000–€10,000 / month
Potential savings: €8,000–€10,000 per stream per month
If we assume:
8–12 similar high-risk streams
Adjust for organizational scale
Expected ROI
Metric | Estimate |
|---|---|
Monthly savings | €80,000 – €120,000 |
Annualized savings | €960,000 – €1.4M |
Payback time | < 1 week |
Accuracy of early detection | high (based on predictive stability) |
Recommended Actions to Reduce Cost
Based on the model’s signal importance and the predicted overshoot:
A. Reduce API Call Volume (Highest Impact)
Identify redundant or system-generated calls.
Deduplicate repeated queries.
Introduce caching for similar prompts.
Rate-limit non-essential departments.
B. Switch to Cheaper Models Where Possible
Reroute GPT-4 calls to GPT-3.5 Turbo or Claude Haiku when tasks allow.
Enforce routing rules via ChordianAI’s optimizer.
Expected savings: 30–70%.
C. Increase Batch Processing Ratio
Consolidate off-peak requests.
Batch long-running or non-urgent inference tasks.
Use async pipelines instead of synchronous calls.
Expected savings: 15–25%.
D. Reduce Off-hours Usage
Shift workloads to business hours or cloud-discount windows.
Schedule overnight jobs for discounted compute periods.
E. Optimize Token Usage
Compress prompts (prompt templates, retrieval-augmented context).
Reduce verbose system messages.
Use summarization before feeding long text.
F. Implement Smart Routing Policy via ChordianAI
ChordianAI can automatically:
Detect when a stream is approaching the threshold
Reroute to the cheapest adequate model
Apply batching
Alert procurement if cost patterns become anomalous
Prevent cost overruns before they happen
Business Summary
UniForecaster predicted an upcoming overspend with strong evidence.
API call volume & cost-per-call are the main drivers.
If no action is taken, this stream will exceed cost thresholds within days.
With optimization, the enterprise can save €1M+ annually.
Automation through ChordianAI enables zero-touch, immediate correction.
Next Steps
Enable automated routing for high-risk streams.
Enable token optimization rules.
Add department-level dashboards showing cost risk distribution.
Onboard additional API streams to the forecasting engine.
Appendix B — Example Workflow: Quantum Routing Optimization
Build QUBO from supply chain data
Solve on Pasqal/QAOA
Validate feasibility
Re-optimize classically
Export final routing
Appendix C — Glossary
QUBO — Quadratic Unconstrained Binary Optimization
PCM Compression — Probabilistic Component Model compression
HIL — Human-in-the-loop
KG — Knowledge Graph

ChordianAI
Change the way you run your business with Chordian AI. Sign up now.
© 2025 All rights reserved